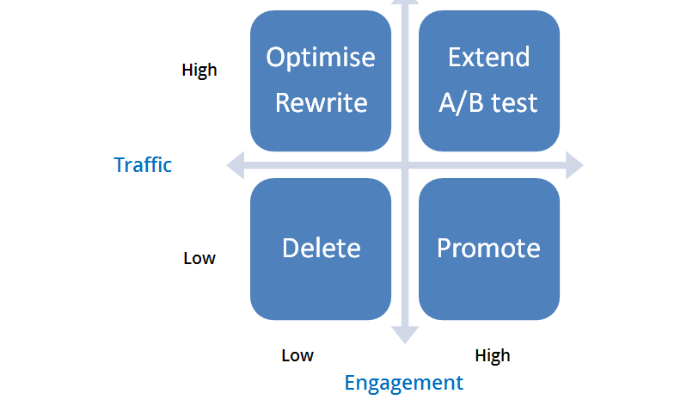
Content performance KPIs come in a few different flavours. Often we will need to quickly assess how much work a large site needs in order to improve its performance, or even if the content created for a campaign needs work.
That is where the content matrix above comes into its own. Similar to BCG’s 2×2, using a measure of engagement (which could be clicks, time on site, conversions, revenue or any measure), and traffic, you can quickly see the actions that need to be taken on that content. A more solid measure would be to give these a factor over time, so clicks per day, so that new content is given the same chance as old content. You can then use scatter graph of engagement vs traffic to see how they apply to specific pieces of content, see below.